Inaccurate stockpile estimates don’t just create paperwork headaches — they quietly drain millions of dollars from operations that can least afford the loss.
Inventory shrinkage in bulk material handling is a significant financial risk in mining and heavy industry. When a coal-fired plant believes it holds 50,000 tons of fuel and the actual figure is closer to 43,000, the gap between perception and reality can trigger emergency procurement, unplanned downtime, or — in worst-case scenarios — a complete operational shutdown. The financial exposure compounds fast.
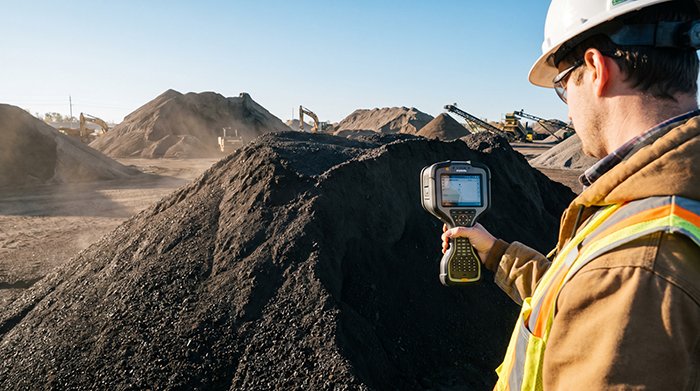
Traditional “walking the pile” methods are still surprisingly common across aggregate yards, cement plants, and mine sites. A survey crew physically traverses a stockpile with GPS equipment, recording elevation points by hand and interpolating volumes from a sparse data set. The problem isn’t effort — it’s geometry. Irregular pile shapes, slumped edges, and surface voids between measurement points introduce compounding errors. According to industry sources, these manual methods routinely produce error margins of 5% to 15%. On a 100,000-ton coal inventory valued at $8 million, a 10% error represents $800,000 of material that either doesn’t exist on paper or doesn’t exist in the yard.
Safety adds another layer of liability. Climbing active stockpiles exposes survey crews to unstable material, dust inhalation hazards, and equipment strike zones. Regulatory pressure to reduce personnel exposure in heavy industrial environments is growing — and relying on a method that puts workers on top of shifting aggregate piles is increasingly difficult to justify.
That’s precisely why the industry is turning toward bulk material volume LiDAR systems — sensors that can capture millions of precise distance measurements from a safe, fixed position. Understanding how those measurements translate into reliable inventory data involves the physics behind the technology, which operates on time-of-flight principles that make accurate 3D reconstruction possible even in demanding industrial environments.
How to Measure Bulk Material with LiDAR Sensors
3D LiDAR stockpile measurement works by firing laser pulses at a surface, timing their return, and stitching millions of distance readings into a precise three-dimensional model — all in seconds, and without anyone climbing a pile.
Time-of-Flight (ToF) principles form the foundation of this process. As explained in a deep dive on how ToF systems work, a ToF sensor emits a laser pulse and measures the elapsed time before the reflected signal returns. Multiply that duration by the speed of light, divide by two, and you get a precise distance reading. Repeat that calculation millions of times per second across a rotating or scanning aperture, and the sensor builds a high-density point cloud — a spatial map composed of thousands of individual XYZ coordinates that faithfully represents every slope, peak, and depression on an irregular stockpile surface.
Converting that raw point cloud into actionable volumetric data follows three core steps:
- Scan — The LiDAR sensor sweeps the stockpile, capturing millions of surface return points that encode exact distance and angle data.
- Process — Software algorithms triangulate those points into a continuous mesh, reconstructing the full three-dimensional surface geometry.
- Calculate — The system computes the volume between the reconstructed surface and a predefined baseline plane, outputting figures in cubic yards, cubic meters, or tons.
Multi-echo pulse detection is what separates practical industrial sensors from laboratory-grade tools. According to industry insights, 3D LiDAR using Time-of-Flight technology employs multi-echo detection to capture secondary and tertiary return signals — meaning the sensor can effectively “see through” airborne dust, registering the material surface rather than the particulate cloud above it. In cement plants, grain terminals, and coal yards where visibility can drop to near zero, this capability is the difference between a usable reading and a corrupted dataset.
Understanding these mechanics sets the stage for appreciating how modern systems move beyond a single snapshot — using moving rail-mounted sensors and real-time software pipelines to turn point clouds into living digital twins of your inventory.
From Point Clouds to Digital Twins: The Estimation System
A complete bulk material estimation system is more than a sensor — it’s an integrated pipeline that transforms raw laser returns into actionable inventory data flowing directly into business systems.
LiDAR sensors mounted on automatic moving rails are the mechanical backbone of that pipeline. Rather than capturing a single static snapshot, the sensor travels along a fixed overhead track, scanning the stockpile from multiple angles as it moves. This traverse-and-scan approach eliminates shadow zones — the blind spots that fixed sensors inevitably create behind steep pile faces — and generates a dense, continuous point cloud that covers the entire material footprint. Research into 3D bulk inventory monitoring confirms, rail-mounted scanning systems deliver repeatable coverage that manual or stationary methods simply cannot replicate.
Once the raw point cloud is captured, surface reconstruction algorithms translate millions of coordinate values into a watertight 3D mesh. This is where geometric complexity matters most. A real-world stockpile is rarely a smooth cone — it has irregular peaks, compaction craters, slumped edges, and load-out voids. Algorithms that account for these peaks and valleys use techniques like Delaunay triangulation or Poisson surface reconstruction to model the true boundary between material and air. The resulting mesh is then compared against a baseline floor scan, and the enclosed volume is calculated with sub-percent accuracy.
“The transition from point-based measurement to area-based 3D scanning is the single most significant factor in reducing ‘shrinkage’ in bulk material accounting.” — Powder & Bulk Solids
That calculated volume is only valuable if it reaches decision-makers instantly. Real-time inventory monitoring LiDAR systems achieve this by streaming processed volume and weight estimates directly to ERP and warehouse management platforms via API connections. Bulk solids measurement analysis notes, this closed-loop integration means procurement, logistics, and finance teams are all working from the same live data — eliminating the reconciliation gaps that fuel shrinkage in the first place. Understanding how point clouds resolve into digital structures helps clarify why this level of spatial fidelity is what makes real-time accuracy possible.
That accuracy advantage becomes even clearer when you compare the approach against traditional point-based sensors — which the next section examines in detail.
Why 3D Scanning Beats Traditional Point-Based Sensors
Understanding how to measure stockpile volume with LiDAR becomes clearer when you compare it directly against the sensor technologies it replaces — and the contrast is stark.
| Sensor Type | Accuracy | Environment Suitability |
|---|---|---|
| Single-point laser | ~85–90% | Poor on irregular surfaces |
| Ultrasonic | ~75–85% | Fails in dust, noise, temperature extremes |
| 2D scanning laser | ~90–94% | Limited cross-section coverage |
| 3D LiDAR | 98–99.5% | High dust, vibration, variable light |
Single-point sensors treat a complex, irregular stockpile as if it were a flat plane — which it never is. A single distance reading taken from above captures one spot on a surface that could slope, crater, or peak unpredictably across dozens of meters. Multiply that error across an entire storage bay and the volume estimate can drift by thousands of tons. That’s not measurement; it’s approximation dressed up as data.
Ultrasonic sensors face a compounding problem. They rely on sound-wave reflection, which degrades rapidly in the noisy, particle-dense air typical of aggregate yards, cement plants, and coal storage facilities. Dust absorbs and scatters acoustic signals; industrial machinery introduces interference; wide temperature swings alter sound propagation speed. The result is readings that are inconsistent at best and dangerously wrong at worst. As bulk material monitoring research confirms, these environmental factors consistently undermine sensor reliability in active industrial settings.
3D LiDAR sidesteps all of those failure modes. By firing millions of laser pulses per second and capturing a dense spatial map of the entire stockpile surface, it achieves the accuracy levels — 98% to 99.5% compared to traditional manual surveying, according to Mining Magazine via industry reporting — that operations teams need to trust their numbers. Where a single-point sensor delivers a handful of samples, a 3D scan delivers a complete topographic picture. That density is precisely what makes time-of-flight ranging so well-suited to uneven, dynamic material piles that change shape with every load and discharge cycle.
Of course, sensor accuracy is only as useful as the environment allows it to perform in — which is where hardware durability and continuous uptime become the next critical variables.
Real-Time Inventory Monitoring in Harsh Environments
Continuous 3D scanning for industrial stockpiles isn’t a luxury — it’s the operational backbone that separates accurate inventory management from costly guesswork in environments that never stop working.
Coal yards, ore handling facilities, and aggregate terminals run around the clock, often in conditions that would disable conventional measurement tools within weeks. Understanding what these environments demand from hardware makes it clear why sensor selection is a non-negotiable decision.
The environmental stressors that LiDAR systems must overcome include:
- 24/7 low-light and zero-light conditions — outdoor yards operate through nights, tunnels, and enclosed storage domes where camera-based systems fail entirely
- Extreme temperature swings — from sub-zero winter nights to summer heat radiating off dark ore piles, thermal cycling degrades uncertified electronics rapidly
- Persistent vibration — conveyor systems, heavy vehicle traffic, and crusher operations introduce constant mechanical stress to any mounted sensor
- Airborne particulates — coal dust, silica, and cement fines settle on optics and infiltrate unsealed enclosures, accelerating hardware failure
- High humidity and precipitation — rain, condensation, and washdown cycles demand fully sealed enclosures, not weather-resistant ones
Rugged, IP-rated hardware isn’t a product upgrade — it’s a minimum operational requirement. Industrial-grade LiDAR units built to IP67 or IP69K standards tolerate full immersion and high-pressure washdowns, directly extending service life and reducing unplanned downtime.
The distinction between continuous monitoring and periodic snapshots matters most when stockpile levels change fast. A single shift can consume hundreds of tons of material, and a snapshot taken at shift start offers no visibility into drawdown rates, unexpected consumption spikes, or supply shortfalls developing in real time. As the Engineering & Mining Journal notes, real-time inventory visibility directly prevents stock-out scenarios and optimizes supply chain logistics — an outcome that periodic surveys simply cannot guarantee.
That real-time data stream becomes even more powerful once it’s connected to the broader operational infrastructure — which is exactly where the next layer of value emerges.
Integrating LiDAR Data into Industrial Workflows
Raw point cloud data only creates value when it flows seamlessly into the operational systems that drive procurement, safety, and site management decisions.
The real power of 3D LiDAR isn’t the scan itself — it’s what happens after the scan reaches your software stack.
API integration is where passive measurement becomes active operations. Modern LiDAR platforms expose standardized APIs that connect directly to ERP and inventory management systems, triggering automated reorder workflows the moment a stockpile volume drops below a defined threshold. Rather than waiting for a manual count to reveal a shortfall, procurement teams receive structured data alerts in real time. According to the Engineering & Mining Journal, continuous scanning allows facility managers to monitor depletion rates in real time — a capability that’s critical for ore processing facilities where a supply interruption can halt an entire production line.
Visualizing depletion rates adds another dimension to that data stream. Time-stamped volumetric models allow operations teams to overlay consumption curves against production schedules, surfacing trends like accelerated drawdown during high-output shifts or unexpected overnight losses that could signal theft or measurement error. These visual dashboards transform abstract point cloud numbers into narratives that plant managers and R&D leads can act on immediately.
Digital twins extend this further into proactive site safety planning. By combining continuous LiDAR scans with a live digital replica of the facility, safety teams can simulate scenarios — slope instability, equipment path conflicts, emergency egress routes — without placing personnel in hazardous zones. This directly reduces human exposure to dangerous areas like active conveyor belts, high-dust environments, and unstable aggregate piles. For facilities exploring how aerial sensing compares to ground-based approaches, digital twin integration often becomes the deciding factor in choosing a deployment architecture.
To see how these integrated workflows perform visually — from point cloud generation to software-driven volume calculation — the next section breaks down a real implementation in detail.
Visualizing Volumetric Accuracy: Implementation Video
Seeing LiDAR point cloud data in action is the fastest way to understand why traditional measurement methods simply can’t compete with 3D scanning for bulk material inventory.
[VIDEO EMBED PLACEHOLDER — LiDAR Point Cloud Processing: From Raw Scan to Volume Calculation]
Video demonstrations of LiDAR-based volume estimation reveal several things worth watching closely. As the scanner captures returns across a stockpile surface, millions of individual data points populate the visualization in near real-time — each one representing a precise coordinate in 3D space. What emerges isn’t just a rough outline of a pile; it’s a dense, textured mesh that captures every slope variation, erosion pocket, and surface irregularity that a manual survey crew would miss entirely.
What makes this footage particularly instructive is the moment the raw point cloud transitions into a processed 3D mesh. The software assigns color gradients to elevation changes, immediately exposing asymmetrical settling, localized extraction zones, and material displacement that would otherwise go undetected between manual count cycles. According to LiDAR stockpile inventory research, these surface irregularities are a primary driver of the inventory discrepancies that erode margin over time.
In coal extraction monitoring scenarios, the value becomes even clearer. As extraction equipment removes material from one face of a stockpile, the 3D model updates continuously — logging not just current volume, but the rate of depletion over time. The software interface typically displays calculated volume against a baseline floor model, with variance thresholds flagged automatically. Understanding how ToF measurement principles underpin this responsiveness helps explain why the system maintains accuracy even through heavy particulate interference.
In practice, watching this workflow from scan capture to volume output compresses what would take a survey team hours into a process measured in minutes — and that operational compression, repeated across every shift, is where the real financial impact accumulates. Those compounding gains are what the takeaways in the next section put into concrete perspective.
The Bottom Line: Key Takeaways for Industrial Leads
3D LiDAR isn’t an incremental upgrade — it’s the structural fix that closes the measurement gap inventory managers have tolerated for decades.
- 99.5% volumetric accuracy is now achievable. LiDAR stockpile scanning routinely delivers sub-percent error rates across coal, ore, grain, and aggregate stockpiles — a standard that no manual rod survey or 2D level sensor can approach.
- ToF technology is the only viable option in high-dust environments. As Sensors Magazine confirms, LiDAR functions reliably in high-dust and low-light conditions where optical cameras fail completely. In practice, a coal yard during active loading operations generates the kind of particulate density that blinds photogrammetry-based systems mid-scan. Time-of-Flight sensors pulse through harsh conditions that stop every alternative dead.
- Real-time monitoring eliminates the 15% error margin of manual surveys. A common pattern in facilities that shift from quarterly walkthroughs to continuous LiDAR scanning is an immediate reduction in inventory discrepancies. Manual surveys compress measurement uncertainty into one snapshot; automated systems catch shrinkage as it happens, removing the compounding error that builds between audits.
- Automated volume estimation is the foundation of the industrial digital twin. Without accurate, continuous volumetric data flowing into ERP and procurement platforms, a digital twin is just a visualization tool. Automated 3D assessment is what converts a static model into a living operational asset — one that updates procurement triggers, flags variance in real time, and grounds every downstream decision in verified geometry.
The technology itself is mature. The outstanding questions tend to be operational: sensor calibration cycles, performance in adverse weather, maximum scan ranges, and how volume figures translate to weight. Those specifics are worth examining closely before any deployment decision.
Frequently Asked Questions About LiDAR Volume Measurement
The most common implementation questions about LiDAR stockpile scanning share a theme: operators want to know exactly where the technology’s limits are before they commit.
Can LiDAR see through heavy rain or fog?
Not perfectly — but modern sensors handle adverse weather far better than older alternatives. According to Blickfeld, multi-echo technology allows LiDAR to filter out noise from rain and dust particles, enabling the sensor to distinguish between interference and actual surface returns. In practice, heavy sustained downpours will reduce effective range and point cloud density, but industrial-grade sensors are engineered to continue operating through light precipitation, fog, and airborne dust common to outdoor stockpile environments. Scheduled scans during weather windows are a straightforward operational workaround for extreme conditions.
How often should sensors be calibrated?
Calibration frequency depends on sensor type and deployment environment. Fixed-mount scanners in stable indoor or covered settings typically require only annual factory calibration checks. Outdoor installations exposed to temperature swings, vibration, and UV exposure may benefit from semi-annual verification against known reference targets. Many modern systems include self-diagnostic routines that flag drift automatically — understanding how sensing hardware is built helps set realistic calibration expectations for your specific deployment.
What is the maximum range for stockpile scanning?
Most industrial 3D LiDAR sensors used for bulk inventory deliver reliable point cloud data at ranges between 100 and 300 meters, depending on beam divergence and target reflectivity. Darker materials like coal absorb more laser energy, reducing effective range compared to lighter aggregates or cement.
How does material density affect volume-to-weight conversion?
Volume measurements from LiDAR are geometric — they calculate cubic meters, not tonnes. Conversion to weight requires applying a bulk density factor specific to the material, accounting for moisture content and compaction state. An error in assumed density directly multiplies into a weight error, which is why pairing scan data with periodic physical density sampling produces the most accurate inventory reconciliation.