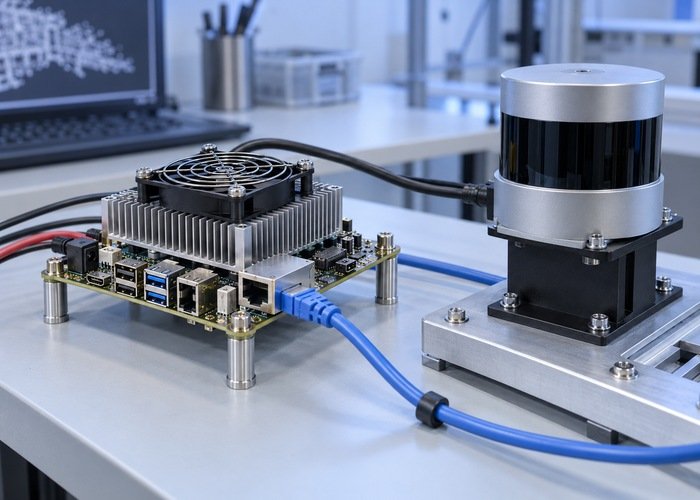
If LiDAR processing latency rises after a Jetson warms up, collect synchronized latency, workload, clock, thermal, and power evidence before naming thermal throttling as the cause. A warmer enclosure and a slower output can occur together without proving that one caused the other. Queue growth, extra consumers, memory pressure, or a changed power state can produce a similar symptom.
Compare a reproducible cold-start run with sustained operation under the same input and configuration. Then perform one justified cooling or workload experiment at a time. Keep the original results and all unsuccessful trials. The decision is whether the installed system meets its sustained latency requirement, not whether it produces one fast frame after boot.
The LiDAR publish-rate diagnostic separates packet arrival, driver output, and subscriber reception. Here the focus is time through the processing path after reception. A stable publication frequency does not guarantee that completed results remain fresh.
Define latency boundaries before logging temperatures
Choose explicit events: driver emission, consumer receipt, processing start, processing completion, and application use. Record the clock used at each event. Distinguish time waiting in a queue from time spent executing work. Also state whether the measurement includes acquisition and transport or begins at host receipt.
The ROS 2 clock-and-time design distinguishes system, steady, and ROS time. Do not subtract timestamps from unrelated clocks and label the result latency. For host-local elapsed intervals, use a suitable consistent clock; cross-device age measurements need an established clock relationship.
Keep sensor timing checks separate using the LiDAR clock-check guide. If recorded data is replayed, document its timing mode and playback rate. A replay run and a live network run answer different questions even when they contain similar scenes.
Freeze the workload and operating configuration
Record module and carrier identities, BSP, kernel, driver and application revisions, power mode, enclosure, cooling assembly, supply arrangement, and ambient conditions. Include point rate, cloud grouping, camera modes, model or algorithm settings, recording, visualization, and every normal consumer. Save the effective configuration loaded by the system.
NVIDIA’s Orin power and performance guide describes interacting power, thermal, and frequency controls. Use the guide matching the installed platform. A selected power mode is context for the experiment, not proof that every clock stays fixed.
Separate startup initialization from steady operation. Record engine loading, map creation, allocation, and any initial compilation as distinct events. Otherwise, one comparison can mix first-use behavior with thermal settling. Define the initial conditions well enough that another engineer can repeat the cold-start sequence.
Align telemetry with the same measurement interval
The tegrastats reference describes memory, processor, frequency, and other platform statistics. Available fields depend on platform and release. Preserve raw output and its sampling interval instead of converting every field into a single generic utilization score.
Align telemetry with latency samples and workload events. Note the time an additional consumer starts, recording begins, queues grow, or a cooling condition changes. A sample taken after the slowdown is weak evidence about the transition that preceded it. Keep logging lightweight enough that it does not create the observed delay.
| Evidence | Record together | Interpretation limit |
|---|---|---|
| Latency distribution | Event boundaries, sample count, interval and clock | An average can hide late results |
| Queue behavior | Depth, input/output rates, drops and waiting age | A busy consumer can accumulate old work |
| Clock and thermal observations | Named fields, values, power mode and workload | Lower frequency alone does not prove thermal limiting |
| Power evidence | Supported telemetry, supply identity and relevant warnings | Different rails or averaging windows are not interchangeable |
| Memory and I/O | Pressure, swap activity and recording behavior | A storage or allocation stall can resemble compute slowdown |
Summarize central latency and a relevant tail percentile, while retaining the raw observations. Report sample count and interval alongside any percentile. Agree an application-specific deadline and treatment of dropped samples before testing; this article supplies no universal acceptable delay.
Define the warm comparison interval in advance using observable operating conditions rather than a universal number of minutes. Retain the full transition and state which samples belong to startup, settling, and sustained operation. If the system never reaches a repeatable operating state, report that behavior instead of selecting a convenient quiet interval.
Check observation overhead with a controlled baseline as well. Excessive point dumps, screen rendering, or high-frequency tracing can alter scheduling and storage load. Keep the production-relevant workload fixed while choosing a bounded logging method, and disclose any observer that was added or removed between runs.
Distinguish normal scaling from a limiting condition
The Linux CPU performance-scaling documentation explains that frequency policy and workload interact. Compare actual frequencies, workload, and available limit indicators over time. A lower clock in an idle interval is different evidence from a constrained clock while work waits.
If queue waiting grows while execution duration stays similar, investigate input/output imbalance first. If execution slows alongside supported thermal-limit evidence, that supports a thermal hypothesis. If the system reports power-related restrictions or supply events, keep that as a separate branch rather than treating all frequency changes as heat.
NVIDIA’s Jetson power-optimization overview provides context for platform observation and power-aware testing. Follow the actual hardware’s supported operating procedure. Do not disable thermal or electrical protection to obtain a better-looking latency trace.
Run a controlled cooling comparison
Use the same input, algorithm, consumer set, and power configuration. Make one manufacturer-supported cooling change, such as correcting an obstructed approved airflow path, and repeat the sustained run under documented ambient conditions. Keep the enclosure state explicit because an open-bench result may not describe the installed product.
A meaningful comparison retains the cold-start sequence, sustained workload, latency boundaries, and observation interval. If several factors change together, label the result exploratory. An improved result supports further investigation but does not isolate cooling from every other difference unless those differences were controlled.
Distinguish processor latency from geometric measurement drift. The LiDAR warm-up reference-part guide addresses changes in measured shape. A point cloud can remain geometrically stable while its processing becomes late, or arrive promptly while its geometry changes.
Decide between integration repair and hardware change
If the original workload meets the deadline after a documented integration correction, preserve that configuration and repeat the acceptance run. If it still fails, identify the limiting stage before choosing more hardware. Extra accelerator capability does not directly resolve every queue, storage, or power-path problem.
Request the relevant carrier-board cooling and power documentation for the installed revision. Keep the module, enclosure, supply, and cooling arrangement in the evidence package. Module-level capabilities do not describe the thermal behavior of every complete system.
Finally, repeat with the actual consuming application. The sensor-fusion requirements guide helps define what must receive a fresh result. Save the raw traces, revisions, configuration, cold/warm comparison, and first supported limiting condition for handoff.
Frequently asked questions
Does rising temperature prove thermal throttling?
No. Correlate latency with workload, clocks, supported limiting indicators, queue behavior, and power evidence. Temperature alone does not establish the cause.
Can a stable cloud rate coexist with rising latency?
Yes. Queues can retain increasingly old work even while messages continue to arrive at a stable rate.
Should maximum clocks be the first repair?
Preserve the baseline first and follow supported platform procedures. Identify the limiting boundary before changing operating conditions.
What makes the cooling experiment repeatable?
The same input, workload, configuration, initial conditions, timing boundaries, and documented environment, with only one justified cooling variable changed.