Passive imaging fails power line inspection at the most fundamental level — it depends entirely on contrast, and a 5mm conductor against a gray sky offers almost none.
Photogrammetry reconstructs 3D geometry by matching visual features across overlapping photographs. That process works reasonably well for broad, textured surfaces. It breaks down completely when the target is a thin, reflective wire suspended in front of variable backgrounds. At conductor diameters measured in millimeters, the signal-to-noise ratio in a pixel-based workflow is too low to guarantee detection, let alone produce measurements accurate enough for regulatory clearance decisions.
LiDAR measures distance, not contrast. Each pulse travels out, strikes a surface, and returns with a time-of-flight measurement precise to a fraction of a nanosecond. Because the technology is active rather than passive, it generates its own illumination, making it immune to flat light conditions, overcast skies, or the visual camouflage that shadows create along a corridor. According to research from the IEEE Power and Energy Society, LiDAR provides active sensing that can penetrate dense canopy to capture thin wires in low-contrast environments — a capability passive photogrammetry simply cannot replicate at scale.
The canopy penetration advantage is significant for lidar power line inspection across vegetated corridors. A single LiDAR pulse entering a tree canopy scatters through multiple return events, simultaneously recording the top of the canopy, intermediate branch layers, and the bare earth beneath — all in one pass. This full vertical profile allows analysts to model conductor position and encroaching vegetation within the same dataset, without a separate ground survey.
Once georeferenced, these discrete point clouds become the raw material for something more powerful than a static map. They form the geometric backbone of a digital twin — a living virtual replica of the physical asset that can be queried, stress-tested, and updated as conditions change. This foundation sets the stage for advanced analysis: modeling how conductors behave under thermal load.
Automating Catenary Curve Analysis and Conductor Sag
Drone LiDAR power line inspection transforms raw point cloud data into precise engineering models that can predict conductor behavior before a failure ever occurs. Where passive imaging captures a snapshot, a high-density 3D point cloud captures physics — enabling analysts to model the catenary curve, the natural arc a suspended conductor forms under its own weight, with sub-centimeter accuracy.
Defining that curve in a point cloud environment is the critical first step. As the IEEE Power and Energy Society confirms, LiDAR point clouds enable precise catenary curve modeling to calculate conductor sag under various thermal conditions. Algorithms strip non-conductor returns from the cloud, isolate the wire’s spatial trajectory, and fit a mathematical catenary function to the resulting point set. The output is a parametric model of the conductor’s geometry at the exact moment of capture.
From there, engineers apply thermal ratings to simulate worst-case sag scenarios. A conductor operating at maximum continuous current rating will expand, elongating and dropping measurably. That thermally-adjusted curve is overlaid on the original capture, and Euclidean distance calculations are run between the simulated conductor position and every object beneath it — ground, crossarms, vegetation, structures. Any point falling inside a regulatory clearance envelope triggers an automated flag.
The variables feeding that model are numerous:
- Conductor temperature range — ambient to maximum operating load
- Span length and tension — derived from attachment-point coordinates in the point cloud
- Wind loading coefficient — applied to calculate lateral swing
- Ground clearance threshold — set per regulatory standard (NESC, local utility codes)
- Structure proximity buffer — cross-arm, tower, and foreign attachment clearance zones
High point density separates reliable models from approximations. Sparse data forces interpolation across long wire segments, hiding the millimeter-level deformations — a subtle flat spot, a hardware-induced kink — that signal early-stage mechanical stress. As 3D sensor fidelity improves, these deformations become identifiable before they propagate into failure events.
That same spatial intelligence doesn’t stop at the wire itself. The classified point cloud surrounding each span contains the vegetation canopy data that feeds the next layer of analysis — identifying which trees pose an imminent strike risk and which are simply growing toward a future problem.
Algorithmic Vegetation Management: Identifying the ‘Danger Tree’
Automated vegetation risk classification turns raw point clouds into prioritized maintenance schedules — replacing subjective field judgments with repeatable, data-driven clearance analysis.
Traditional ROW inspections required crews to make immediate decisions about which trees posed threats. This subjectivity led to inconsistency and, in worst-case scenarios, missed encroachments that caused outages. LiDAR-equipped drones fundamentally change that dynamic by giving algorithms — not fatigue-prone technicians — the final say on risk classification.
Strike-in threats are the most time-sensitive category. These are trees or limbs whose current spatial position already places them within, or dangerously close to, minimum clearance buffers. Using three-dimensional point distributions, automated systems measure the precise horizontal and vertical offset between each detected vegetation mass and the conductor geometry modeled in earlier catenary analysis. Any object breaching a defined tolerance triggers an immediate work order — no manual review required, no ambiguity about what “close enough” means.
Grow-in threats demand a different analytical layer. Here, NERC guidelines describe how automated systems use LiDAR intensity returns — the reflectance signature each pulse produces — to classify vegetation species. Because different species reflect near-infrared wavelengths at measurable rates, the algorithm can infer not just current height but likely growth trajectory. A fast-growing softwood 12 feet from a conductor today may be a strike risk within 18 months; a slow-growing hardwood at the same distance may be safely deferred. This species-aware modeling is what separates predictive vegetation management from reactive trimming.
That predictive capability flows directly into ROW maintenance scheduling. Instead of uniform annual crews, utilities can generate dynamically prioritized work lists — deploying resources to highest-risk segments first. The BVLOS case study data from LiDAR News reinforces this efficiency: corridor-scale drone surveys that once required weeks of ground crew access can now produce actionable vegetation maps in days.
The same classification engine that protects linear transmission corridors applies to the dense, complex infrastructure at substations — a challenge requiring its own dedicated approach.oach.
The Substation Gap: Mapping Complex 3D Infrastructure
Substations are among the most data-poor assets in a utility’s network — yet they concentrate the highest density of critical equipment, clearance requirements, and structural complexity on the entire grid.
Drone LiDAR is closing that gap fast, turning energized substation environments into accurate, navigable 3D models without putting a single technician inside the danger zone.
Navigating High-EMI Environments. Traditional survey methods struggle inside substations. Dense transformer banks, bus bars, and insulator strings create vertical structures that ground-based measurements can’t fully characterize. Electromagnetic interference (EMI) from energized equipment routinely disrupts GPS signals and onboard electronics, making precision positioning a persistent engineering challenge. Purpose-built UAV payloads address this with hardened sensor enclosures and inertial measurement units (IMUs) that maintain accuracy even when satellite lock degrades — a capability detailed in the multi-axis sensing principles behind modern rotating LiDAR designs.
Post-Storm Damage Assessment. After a severe weather event, utilities face pressure to restore power quickly — but sending crews into a damaged substation before structural integrity is confirmed is a serious safety liability. Drone LiDAR enables rapid aerial surveys that document displaced equipment, downed conductors, and compromised insulator strings within hours. The resulting point cloud can be compared against a pre-storm baseline model to flag every dimensional anomaly, accelerating both damage documentation and insurance claims.
Retrofit Planning and Expansion. High-fidelity 3D substation models are increasingly essential for engineers planning equipment upgrades or capacity additions. Clash detection — identifying where new conduit runs or transformer pads would conflict with existing structures — becomes straightforward when the full environment exists as a navigable digital twin. The spatial modeling techniques used in continuous SLAM operation translate directly to this substation workflow.
The same operational discipline that drives vegetation management drones across miles of transmission corridor applies here: collect dense, calibrated data remotely, analyze it safely in the office, and deploy crews only where the data confirms it’s necessary. That efficiency case becomes even more compelling when examined at the network scale — which is exactly where the next section picks up.
Operational Efficiency: 10x Faster Than Ground Patrols
Drone-based LiDAR has fundamentally redefined what’s possible in transmission corridor inspection — cutting the time required by an order of magnitude while capturing far richer data than any ground crew could gather.
As covered in earlier sections, the jump from manual vegetation classification to algorithmic risk scoring depends entirely on having dense, reliable point cloud data to work with. That data bottleneck is where ground-based patrols consistently fail — and where aerial workflows deliver a decisive advantage.
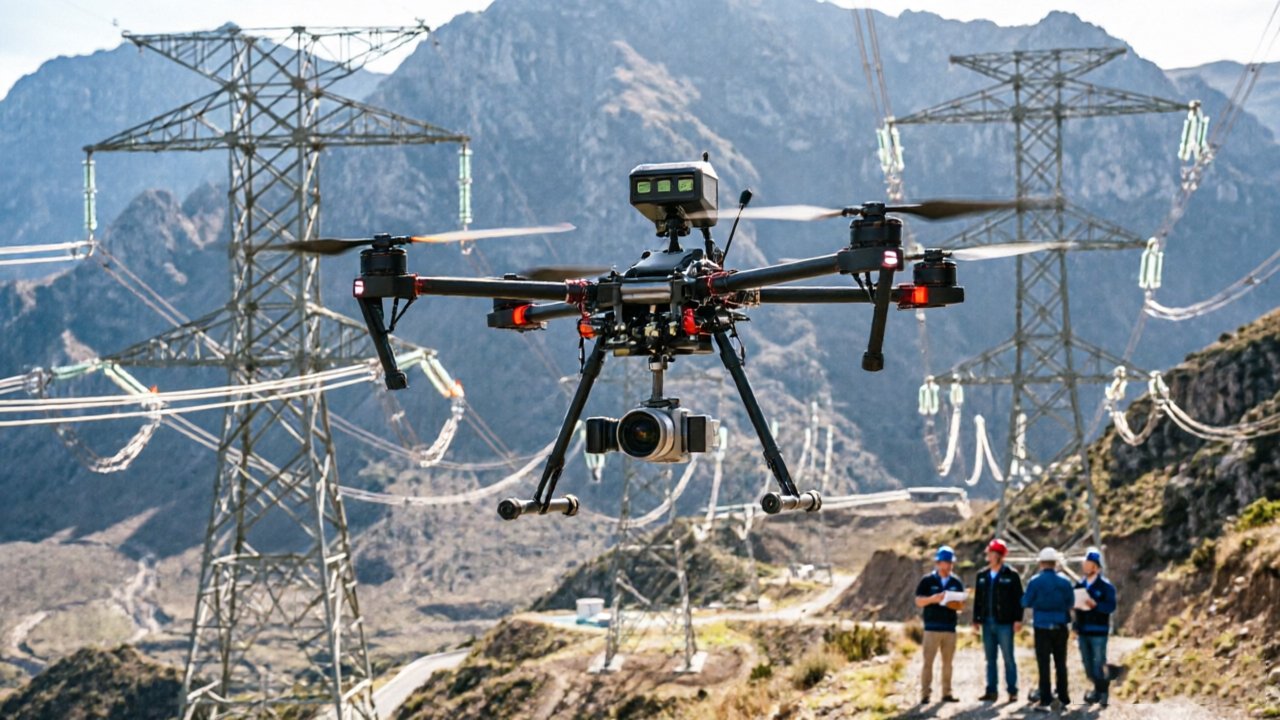
Traditional ground patrols cover 2–5 circuit miles per day on average, depending on terrain and crew size. A drone operating under BVLOS authorization can survey that same corridor in a fraction of the time, with the Electric Power Research Institute (EPRI) reporting that drone-based LiDAR inspections complete up to 10 times faster than conventional ground methods. For utilities managing hundreds or thousands of miles of transmission lines, that multiplier translates directly into faster risk identification and reduced outage exposure.
The terrain factor compounds this advantage significantly. Ground crews in rugged, forested, or mountainous corridors depend on bucket trucks, manual climbing equipment, and extended travel time just to reach access points. Drones eliminate that logistical overhead entirely. A BVLOS case study covering 77 miles of infrastructure demonstrated that aerial LiDAR can acquire actionable clearance data across challenging terrain without a single ground crew deployment — a practical impossibility at equivalent scale using manual methods.
Data density tells an equally compelling story. Manual patrol notes might capture dozens of discrete measurements along a corridor. A single drone LiDAR pass returns millions of 3D coordinate points per kilometer, enabling precise clearance calculations, conductor sag modeling, and encroachment detection that sparse manual records simply cannot support.
The cost-benefit case ultimately favors proactive aerial inspection over reactive maintenance. Replacing failed equipment after a fault event — particularly one involving wildfire — carries costs that dwarf the investment in regular drone surveys. Powerline substation inspection intervals can be extended or optimized when corridor data is current, accurate, and continuously actionable.
The operational efficiency gains documented here connect directly to a broader question utilities increasingly face: how do you prove, to regulators and courts alike, that your inspection program met the required standard of care?

Regulatory Compliance and the Legally Defensible Audit Trail
LiDAR-collected data is rapidly becoming the gold standard for utility compliance documentation — transforming inspections from subjective field notes into court-ready, georeferenced evidence.
The shift from “best effort” visual checks to absolute 3D measurements fundamentally changes a utility’s legal posture. Traditional line patrols produced written reports, photographs, and inspector estimates — all of which carry inherent subjectivity. A missed clearance violation under that model could expose a utility to significant liability with little documentation to mount a defense. High-density LiDAR changes that equation entirely. Every scan produces a time-stamped, GPS-referenced point cloud that captures exact conductor positions, sag profiles derived from catenary curve modeling, and vegetation encroachment distances down to centimeter-level precision. That data doesn’t fade, misremember, or vary between inspectors.
For NERC and FERC audits, this matters enormously. Regulators increasingly expect utilities to demonstrate compliance through verifiable, repeatable measurements rather than anecdotal records. A georeferenced dataset captured on a specific date and time gives compliance officers a defensible answer to the question: “What was the clearance on that span on that day?” No legacy inspection method can match that specificity.
“The transition from visual inspection to LiDAR-based automated analysis reduces human error in clearance reporting and provides a legally defensible record of utility compliance.” — Utility Dive / Industry Expert Analysis
Wildfire litigation has made this documentation imperative. In post-ignition investigations, the first question is whether a conductor was within safe distance of vegetation. Utilities with granular LiDAR records can demonstrate due diligence with precision that visual logs simply cannot provide. That distinction can mean the difference between a manageable settlement and catastrophic liability exposure.
Standardizing this reporting across multi-state territories adds another layer of value. A consistent data schema — same coordinate systems, same classification protocols, same clearance thresholds — ensures that compliance teams in different regional offices are working from identical analytical baselines. The raw point cloud data that makes this consistency possible is only as useful as the tools used to process and visualize it, which is exactly where the workflow from capture to actionable insight becomes critical.
Visualizing the Workflow: From Point Cloud to Actionable Insight
Raw LiDAR data only becomes operational intelligence when it moves through a disciplined processing pipeline — transforming billions of laser returns into decisions that protect infrastructure and lives.
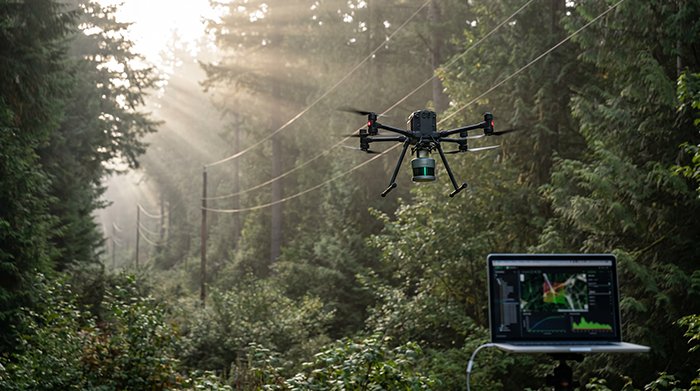
The workflow begins the moment the drone is airborne. During flight, UAV pilots monitor real-time point cloud visualization feeds that display returning data as it’s captured. This live preview isn’t just for aesthetics — it serves a critical quality-control function. Pilots can immediately identify coverage gaps, sensor blind spots, or corridors where canopy density may have obscured returns, allowing for on-site re-flight rather than costly return visits. BVLOS operations that extend beyond traditional visual range depend especially on this feedback loop, since pilots cannot rely on line-of-sight observation to verify coverage quality.
Post-processing then refines the raw capture into a usable high density point cloud. Noise reduction algorithms strip out erroneous returns caused by atmospheric interference, insects, or sensor artifacts. Ground classification is where the real analytical power emerges — advanced algorithms analyze return signals to differentiate between stable ground surfaces, low-lying brush, and high-risk encroaching branches, as established by NERC standards for vegetation management. The result is a clean, classified dataset ready for clearance analysis.
GIS and asset management integration is the final bridge between data and action. Classified point clouds are ingested into enterprise GIS platforms, where conductor sag measurements, vegetation encroachment flags, and span-level risk scores are mapped against existing asset records. Maintenance crews receive geo-tagged work orders. Asset managers see corridor-wide risk dashboards updated with each inspection cycle.
The embedded video below demonstrates LiDAR-based real-time detection in action — showing exactly how raw returns become structured intelligence within minutes of flight completion.
[▶ Watch: LiDAR-Based Real-Time Power Line Detection in Action]
Understanding this pipeline end-to-end is what separates utilities that collect data from those that act on it — a distinction worth examining further as we consolidate the strategic case for R&D investment.
Key Takeaways for Utility R&D Leads
Drone-mounted LiDAR has moved from experimental pilot to operational necessity — and these core principles summarize why utility R&D teams are accelerating adoption across their transmission portfolios.
LiDAR is the only sensor technology capable of reliable thin-wire detection around the clock. Unlike optical cameras that depend on ambient lighting, LiDAR’s active pulse illumination penetrates low-light conditions, fog, and dawn/dusk scenarios where conventional visual inspection fails entirely. For a conductor that can sag inches within minutes under thermal load, that 24/7 detection window is operationally non-negotiable.
- Automated sag analysis unlocks grid capacity that already exists. By replacing conservative static line ratings with data-driven dynamic line ratings, utilities can route significantly more power through existing infrastructure — deferring costly capital projects while meeting demand growth.
- Algorithmic vegetation prioritization cuts crew costs. Rather than dispatching ground crews on fixed calendar schedules, risk-ranked encroachment maps direct resources only to the highest-threat spans, compressing clearance budgets without compromising reliability.
- Digital twins create a living audit record. As Utility Dive notes, LiDAR-collected data produces a georeferenced, time-stamped 3D record that functions as an objective audit trail — giving regulatory bodies the defensible documentation they increasingly require.
- BVLOS authorization accelerates the ROI curve. As covered in this article, pairing high-density LiDAR with approved BVLOS operations allows a single drone to survey corridor lengths that would take ground crews days, compressing inspection cycles from weeks to hours.
Taken together, these advantages reinforce a single conclusion: high-density LiDAR inspection is not a technology upgrade — it’s a strategic infrastructure decision. The next section explores how to scale that decision from a single pilot corridor to a fleet-wide deployment built to grow with your grid.
Future-Proofing the Grid: Scaling Your LiDAR Operations
Scaling drone LiDAR from a single pilot corridor to fleet-wide deployment is the defining operational challenge for utility R&D teams in 2024 and beyond.
Sensor selection is the foundation of any scalable program. The core tradeoff is point density versus payload weight — higher-density sensors capture the millimeter-level structural deformations that EPRI research confirms human eyes routinely miss, but heavier payloads reduce flight endurance and increase platform costs. In practice, a modular sensor architecture — pairing a mid-weight LiDAR unit with a compact IMU and edge-processing unit — tends to deliver the best balance across mixed terrain and conductor types.
Budget discipline starts at procurement. Factory-direct sourcing eliminates distributor markups and gives R&D teams direct access to firmware updates, calibration support, and volume pricing. For organizations managing multi-year capital budgets, that direct relationship also enables custom configuration agreements — critical when standardizing sensor specs across a growing fleet.
The pilot-to-fleet transition requires a staged rollout strategy. A common pattern is to validate one corridor, document processing workflows, then replicate across priority spans before committing to full deployment. Teams that skip this structured handoff often encounter data format inconsistencies and crew training gaps at scale.
FAQ: Drone LiDAR for Power Line Clearance
Q: What point density is sufficient for clearance analysis?
A minimum of 100 points per square meter is the operational threshold for reliable conductor sag modeling; denser capture improves vegetation encroachment detection significantly.
Q: How does BVLOS authorization affect deployment timelines?
BVLOS waivers typically add 60–120 days to program launch; building FAA coordination into your procurement timeline prevents schedule slippage.
Q: Can existing survey crews operate LiDAR-equipped drones?
Most crews require 20–40 hours of platform-specific training before achieving consistent data quality on live infrastructure.
Q: What’s the ROI timeline for a LiDAR program?
Utilities that transition from helicopter surveys typically recover capital costs within 18–24 months through reduced flight hours and faster anomaly detection cycles.
The grid’s reliability future depends on moving beyond reactive inspection — and high-density drone LiDAR is the technology making proactive, continuous clearance analysis operationally and economically viable. Now is the moment to move from pilot to permanent.